May 20, 2026 · 10 min read
Nogales, Arizona — The Sinaloa-Sonora Produce Gateway
Real shipment data, real importers — Nogales handles 43,246 produce truckloads in Q1 2026, 93.8% of Arizona's volume, with a top-15 US importer roster and top-10 Mexican shipper roster mapped from primary CBP records.
Nogales, Arizona handles 43,246 produce truckloads at $668 million in January-March 2026 (Q1 2026, three-month window) — 93.8% of Arizona's total Mexican-produce volume (43,246 ÷ 46,084 = 93.8%) and 29.8% of every Mexican produce truck crossing into the United States in the window (43,246 ÷ 145,009). Only one US port crosses more Mexican produce than Nogales, and it's not close: Pharr-McAllen in Texas at 48,359 trucks. After those two, the next-largest single crossing point (Laredo's World Trade Bridge at 11,782 trucks) handles roughly a quarter of Nogales's volume (11,782 ÷ 43,246 = 27.2%).
The Nogales corridor is structurally distinct from the Texas corridor. Different growing regions feed it, different commodities cross it, and a different importer-shipper ecosystem clears the cargo. This guide maps it with primary CBP data — what crosses, which US buyers receive the trucks, which Mexican shippers send them, and which specific Nogales port-of-entry handles the volume.
The National Context — Nogales in the US-Mexico Produce Map
Mexican produce enters the United States through roughly a dozen land crossings. Two ports handle the majority. The top eight in January-March 2026:
| Rank | US Port | Mexican Port (custom_port_state) | Trucks | Value (USD) |
|---|---|---|---|---|
| 1 | Pharr / McAllen, TX | Ciudad Reynosa (Tamaulipas) | 48,359 | $1.62B |
| 2 | Nogales, AZ (Mariposa + DeConcini) | Nogales (Sonora) | 43,246 | $668M |
| 3 | Laredo, TX (World Trade Bridge) | Nuevo Laredo (Tamaulipas) | 11,782 | $677M |
| 4 | Otay Mesa, CA | Tijuana (Baja California) | 10,768 | $428M |
| 5 | Calexico, CA | Mexicali (Baja California) | 8,087 | $177M |
| 6 | Laredo, TX (Colombia Solidarity) | Colombia (Nuevo León) | 8,022 | $653M |
| 7 | Donna, TX | Las Flores / Rio Bravo (Tam.) | 5,139 | $29M |
| 8 | Roma / Rio Grande City, TX | Ciudad Miguel Alemán (Tam.) | 4,417 | $112M |
Pharr-McAllen and Nogales together account for 63.2% of all Mexican produce trucks crossing into the US in the three-month window (91,605 ÷ 145,009 = 63.2%). For the Texas side of the picture, see our Texas border crossings guide; this guide is the Arizona-Sonora counterpart. For the Yuma-corridor specialty crossing, see our San Luis corridor guide.
Why Nogales is the Sinaloa-Sonora Gateway
Nogales's volume comes from geography, infrastructure, and a century of accumulated produce-industry expertise.
Geography — Highway 15 from Culiacán. Nogales, Arizona sits directly across the border from Nogales, Sonora. Mexico's Federal Highway 15 runs south from Nogales straight through Sonora and into Sinaloa, the country's largest produce-exporting state. The Culiacán valley — Mexico's primary greenhouse and shadehouse production region for winter tomatoes, peppers, cucumbers, and squash — is roughly 1,200 km south of the Nogales crossing. Sonora's own production regions (Hermosillo, Caborca, Guaymas) are closer still, feeding watermelons, table grapes in season, and citrus directly into the port. What does not cross Nogales: Sonora's leafy-greens, asparagus, and date production. That volume routes ~250 miles west to San Luis, AZ — covered in our San Luis corridor guide.
Cold-chain infrastructure. The Nogales area has over 100 cold-storage and distribution facilities concentrated within a few square miles of the border (per the Fresh Produce Association of the Americas). Mexican produce is received, inspected, sorted, US-labeled, and reloaded onto northbound reefers — typically within hours of crossing. PTIQ data confirms approximately 481 produce trucks per day cross at Mariposa during the Q1 2026 window (43,246 ÷ 90 days), consistent with FPAA's longtime industry estimate of 300-500 daily during peak winter season.
USDA, APHIS, and FDA inspection density. Nogales hosts one of the largest USDA inspection footprints on the southern border, purpose-built for produce. APHIS handles phytosanitary, AMS conducts grade evaluation, and FDA reviews food safety — all at the same Mariposa site. Inspection staff is tuned for high-volume reefer throughput, which means faster clearance than ports that process produce only occasionally.
FPAA-anchored importer community. The Fresh Produce Association of the Americas (FPAA), headquartered in Nogales, represents over 100 member companies and has been the produce-industry's voice in the corridor since 1944. The Nogales importer roster reflects this — multi-generational family businesses tightly clustered within ten miles of Mariposa, structurally distinct from the Texas Rio Grande Valley distributor community.
What Crosses at Nogales: The Commodity Mix
Ten HS4 categories carry the volume. Four of them dominate:
| HS4 | Category | Trucks | Value (USD) |
|---|---|---|---|
| 0702 | Tomatoes | 10,144 | $266M |
| 0709.60 | Peppers / chiles | 8,801 | $159M |
| 0709.9x | Squash & mixed cucurbits | 7,939 | $57M |
| 0707 | Cucumbers | 7,678 | $80M |
| 0807.1 | Watermelons / cantaloupes | 3,744 | $19M |
| 0709.30 | Eggplant | 1,324 | $15M |
| 0805.1 | Oranges / citrus | 897 | $9M |
| 0804.50 | Mangoes / guava | 681 | $22M |
| 0708.2 | Green beans | 513 | $11M |
| 0708.9 | Other beans | 254 | $4M |
The "Big Four" — tomatoes, peppers, squash, and cucumbers — together account for 34,562 trucks, or 79.9% of Nogales volume (34,562 ÷ 43,246 = 79.9%). This is the Sinaloa winter greenhouse signature, and the four commodities cross together because the same growers, packers, and US importers run them as a bundle.
For commodity-specific corridor structure see our top tomato importers guide, pepper and chile importers guide, and cucumber importers guide. Nogales is the dominant US-side gateway for all three categories, with Pharr running secondary on tomatoes and primary on Tamaulipas-state production. For the upstream view, our Sinaloa export guide maps which Sinaloa municipalities feed each Big Four category and which states they exit through.
Watermelons (3,744 trucks) and mangoes (681 trucks — strong March-season ramp) round out the meaningful volume — see our watermelon importers guide and mango importers guide for the specific Nogales-bound roster on each. What does not cross Nogales: limes. Despite frequent assumption otherwise, Tamaulipas-routed Veracruz and Michoacán lime production reaches Pharr, not Nogales — see our lime importers guide and Persian vs Tahiti lime cultivar guide for the cultivar and corridor split.
The Nogales Importer Roster
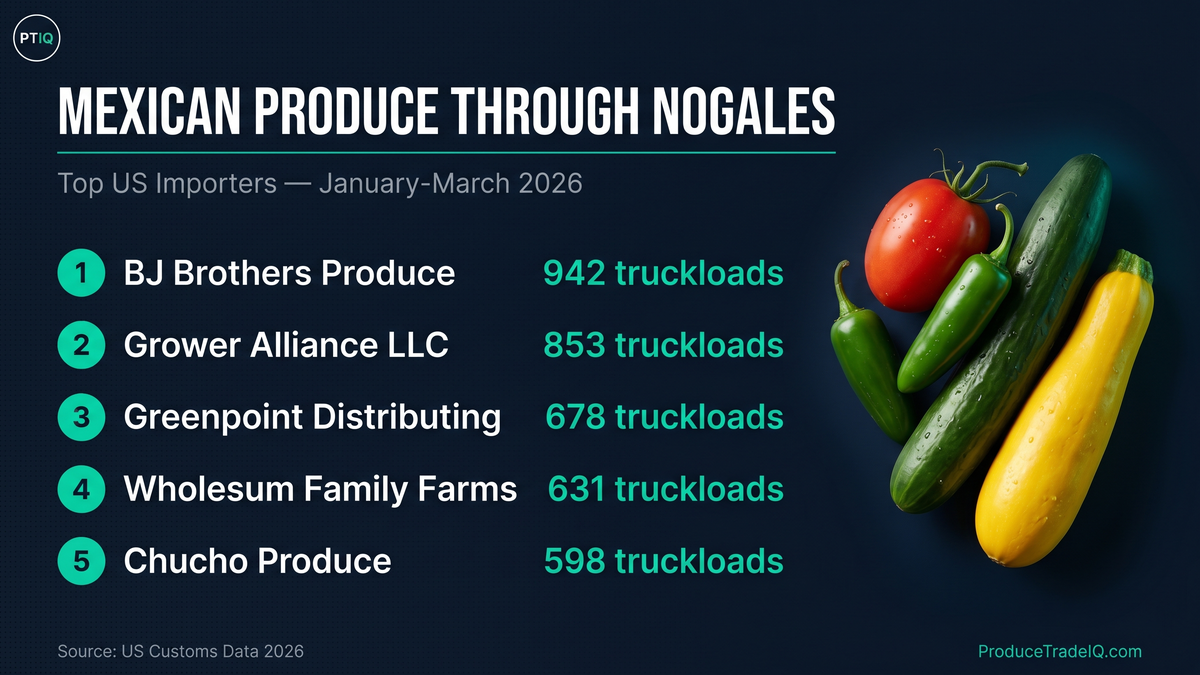
These are the top 15 US importers receiving Mexican produce at Nogales in January-March 2026 — derived from CBP shipment records, with broker placeholders and aggregator entities excluded:
| # | US Importer | Trucks | Decl | Value (USD) | Commodity mix (HS4) |
|---|---|---|---|---|---|
| 1 | BJ Brothers Produce | 942 | 11 | $12.5M | tomatoes, cucumbers, peppers, melons |
| 2 | Grower Alliance LLC | 853 | 149 | $7.4M | cucumbers, beans, peppers, squash, melons |
| 3 | Greenpoint Distributing LLC | 678 | 115 | $3.1M | cucumbers, eggplant, beans, peppers, squash, citrus, melons |
| 4 | Wholesum Family Farms Inc. | 631 | 43 | $7.8M | tomatoes, cucumbers, eggplant, peppers, squash (organic focus) |
| 5 | Chucho Produce LLC | 598 | 62 | $15.1M | tomatoes, cucumbers, peppers |
| 6 | Produce House LLC | 578 | 38 | $6.1M | tomatoes, cucumbers, peppers, squash, citrus, melons |
| 7 | SL Produce LLC | 564 | 119 | $10.8M | tomatoes, cucumbers, beans, peppers, squash, mangoes |
| 8 | Big Chuy Distributors & Sons Inc. | 451 | 34 | $1.2M | squash, melons |
| 9 | Happy Produce Inc. | 397 | 13 | $2.3M | cucumbers, peppers |
| 10 | Ideal Harbest LLC | 396 | 66 | $10.6M | tomatoes, cucumbers, beans, eggplant, peppers, squash |
| 11 | IPR Fresh | 384 | 12 | $2.8M | cucumbers, peppers |
| 12 | Ag Mart Produce Inc. | 368 | 13 | $10.7M | tomatoes, cucumbers, squash |
| 13 | Shipley Sales LLC (new in Q1 2026) | 354 | 25 | $0.06M | watermelons / cantaloupes (pure-play) |
| 14 | Fivecrowns Inc. (new in Q1 2026) | 339 | 3 | $1.4M | watermelons / cantaloupes (pure-play) |
| 15 | TruFresh | 336 | 12 | $3.0M | peppers (pure-play) |
Read: the Nogales top 15 collectively handle 7,869 trucks — 18.2% of Nogales volume (7,869 ÷ 43,246 = 18.2%) — across a dense FPAA-ecosystem community. The roster has almost zero overlap with the Laredo importer community that ranks high in our Texas corridor analysis (Henry Avocado, West Pak, Fronterra, NS Brands/NatureSweet, Mastronardi/Sunset, Nature Fresh Farms). These are two parallel ecosystems with different buyer rosters, different commodity emphasis, and different upstream Mexican-state supply bases. Nogales = Sinaloa/Sonora winter greenhouse; Laredo = Michoacán avocados + branded greenhouse vegetable brands. The two communities barely overlap.
The Q1 2026 roster has two structural shifts from earlier-window data: BJ Brothers Produce now leads at 942 trucks (was #3 in Jan-Feb at 491), reflecting a near-doubling on the same March seasonal ramp; and two new watermelon-cantaloupe pure-play arrivals — Shipley Sales LLC (354 trucks) and Fivecrowns Inc. (339 trucks) — enter the top-15 at #13 and #14 as the Sonora melon season ramps into March. Both run single-HS4 programs (HS 0807.1 watermelons / cantaloupes) typical of seasonal melon-corridor specialists. Eagle Eye Produce, which was #14 in Jan-Feb, falls just outside the Q1 2026 top-15.
Wholesum Family Farms is the only "branded organic greenhouse" name in the Nogales top 15 — and even Wholesum's Q1 2026 volume (631 trucks) is roughly two-thirds of NatureSweet's Laredo volume. SunFed Produce LLC (333 trucks, just outside the top-15 at #16 in Q1 2026) is one of the longest-tenured Nogales-area distributors and appears in FPAA-member references regularly. The remaining names — Grower Alliance, Greenpoint, Chucho, Produce House, SL Produce, Big Chuy, Happy Produce, Ideal Harbest, IPR, Ag Mart — are mostly multi-generational Nogales-area family operations.
Top Mexican Shippers Through Nogales
This is the corridor-specific Mexican-side roster — the top 10 shippers exporting through Nogales in January-March 2026:
| # | Mexican Shipper | Trucks | Decl | Value (USD) | Commodity profile |
|---|---|---|---|---|---|
| 1 | Ceuta Produce S de RL de CV | 1,634 | 13 | $24.3M | tomatoes, cucumbers, eggplant, peppers |
| 2 | International Greenhouse Produce SA de CV | 1,427 | 76 | $25.6M | tomatoes, cucumbers, peppers |
| 3 | Agrícola La Tuxcana SA de CV | 1,156 | 30 | $13.9M | tomatoes, cucumbers, eggplant |
| 4 | Rancho Agrícola Las Cabras SPR de RL de CV | 1,139 | 26 | $16.5M | tomatoes, cucumbers, peppers, melons |
| 5 | Agrícola La Primavera SA de CV | 964 | 13 | $20.6M | tomatoes (pure-play) |
| 6 | Agrícola TIGA SA de CV | 917 | 42 | $5.9M | squash (96.6%); tomatoes entering in March (30 trucks) |
| 7 | Agrícola Bay Hermanos SA de CV | 735 | 69 | $7.6M | tomatoes, cucumbers, peppers, squash |
| 8 | Agrofesa SA de CV | 717 | 77 | $6.0M | cucumbers, eggplant, peppers, squash |
| 9 | Cardenas / Cevallos / Daniel | 685 | 14 | $7.1M | tomatoes, cucumbers, eggplant, peppers |
| 10 | Agrícola de Gala SA de CV (new in Q1 2026) | 635 | 53 | $4.2M | cucumbers, peppers |
Read: the top 10 Mexican shippers move 10,009 trucks combined — 23.1% of Nogales volume (10,009 ÷ 43,246 = 23.1%) — concentrated more heavily than the US importer side. Ceuta Produce alone moves more than 1,600 trucks in the three-month window out of just 13 declarations, indicating very large, infrequent consolidated loads typical of major greenhouse operations.
Two structural patterns are visible. Pure-play shippers — Agrícola La Primavera (tomatoes only), MJ International / Moliex (cucumbers only, just outside the top-10 at #11 with 531 trucks) — run single-commodity programs aligned to dedicated production blocks. Diversified shippers — Ceuta, International Greenhouse, Bay Hermanos, Las Cabras, Cardenas/Cevallos, and now Agrícola de Gala (a Q1 2026 new arrival displacing MJ International from the top-10) — cross four-to-five Big Four commodities together, typical of multi-greenhouse Sinaloa operations packing mixed loads. For buyers, the pure-play vs diversified distinction matters when matching a Mexican supplier to a US program's seasonality and consistency requirements.
Mariposa vs DeConcini vs Morley
Nogales has three ports of entry, but only one handles commercial produce:
Mariposa Port of Entry (west of downtown) is the commercial cargo crossing. Expanded in 2014 and again in 2019 specifically to increase truck processing capacity, Mariposa is where USDA, APHIS, and CBP conduct inspections on incoming produce. The PTIQ-recorded ~481 trucks per day during the Q1 2026 winter window all cross here. If a Sinaloa or Sonora supplier is sending you a load, it is moving through Mariposa.
DeConcini Port of Entry (downtown) handles pedestrian and passenger vehicle traffic. It does not process commercial produce shipments, despite being the most well-known Nogales crossing by name.
Morley Gate is a smaller pedestrian crossing with limited hours, with no commercial role.
The CBP-shipment data has a single NOGALES SONORA custom_port_state value covering all Sonora-side Nogales traffic, so the data cannot directly distinguish Mariposa vs DeConcini at line-item level — but operationally 100% of the commercial produce volume reported here crosses Mariposa. For background on the four customs systems behind these records (entry summary, BOL, AMS manifest, Pedimento), see our CBP AMS data explainer.
How to Choose Nogales vs Pharr vs Otay Mesa
Match the commodity and the origin region to the corridor:
- Sinaloa-origin greenhouse tomatoes, peppers, cucumbers, squash, eggplant, melons → Nogales. The mainstream winter Mexican-vegetable corridor. The vast majority of Sinaloa's Culiacán-valley greenhouse output crosses here.
- Sonora-origin watermelons, cantaloupes, table grapes (in season), citrus → Nogales. The closer-in Sonora production regions feed directly into Mariposa.
- Tamaulipas-origin tomatoes, peppers, cucumbers, onions, watermelons → Pharr / McAllen, TX. See our Texas border crossings guide and McAllen-Pharr port guide for the eastern corridor's structure.
- Michoacán Hass avocados → Laredo, TX, not Nogales. The Michoacán-to-Laredo inland route via Federal Highway 57 is the avocado superhighway; Nogales sees essentially no avocado traffic.
- Limes (Persian / Tahiti and Key) → Pharr, not Nogales. The Veracruz / Michoacán lime production reaches Texas via Tamaulipas corridors. See our Persian vs Tahiti lime guide for the cultivar split and lime importers guide for the buyer roster.
- Baja California greenhouse production → Otay Mesa, CA. Mexicali and Tijuana-Sonora-distinct production flows route here.
- Yuma-region leafy greens, asparagus, dates, Brussels sprouts, cauliflower → San Luis, AZ, not Nogales. Despite Sonora-state production, this Yuma-adjacent commodity bundle crosses 250 miles west of Nogales. See our San Luis corridor guide for the full Yuma-corridor structure.
For pricing context, each US-side crossing produces its own USDA Market News FOB shipping-point quotes — Nogales's daily quotes are the benchmark for Sinaloa-Sonora greenhouse production, just as Pharr's quotes are the benchmark for Tamaulipas. See our FOB pricing explainer for how FOB SC and Incoterms FOB differ and how to read the daily Pharr and Nogales quotes.
Getting Started
Nogales is the western half of the US-Mexico produce corridor — the Sinaloa-Sonora gateway for the Big Four winter vegetables, with a dense FPAA-anchored importer community and a Mexican-shipper roster concentrated around a dozen major operations. Pharr leads in absolute volume; Nogales leads in commodity diversity and Sinaloa-greenhouse share.
Start your free trial on ProduceTradeIQ to filter shipments by Nogales crossing, see who is buying through Mariposa vs Pharr, identify Mexican shippers active in the Sinaloa-Sonora corridor, and track USDA FOB prices at the Nogales shipping point. No credit card required.
Data sources: CBP-derived shipment records via the ProduceTradeIQ platform (mx_shipments table). Window: January 1 – March 31, 2026 (Q1 2026, three-month window). Nogales-AZ attribution derived from the NOGALES SONORA custom_port_state value, which covers all commercial produce traffic across Mariposa and DeConcini ports of entry (with 100% of commercial cargo crossing at Mariposa per CBP designation). Truckload counts derived from line-item kilograms divided by 22,000 kg standard refrigerated trailer payload. USD values are sums of CBP-reported invoice values. Broker placeholders and aggregator entities flagged in the ProduceTradeIQ audit are excluded. FPAA membership and cold-storage facility counts cited from publicly available Fresh Produce Association of the Americas sources; daily truck-volume figures are PTIQ-derived from the Q1 2026 window (43,246 trucks ÷ 90 days = 481 trucks/day) and reported alongside the FPAA estimate range for consistency check. Concentration percentages computed as count ÷ window total; Nogales share of Arizona 93.8% = 43,246 ÷ 46,084; Nogales share of national 29.8% = 43,246 ÷ 145,009; Big Four share of Nogales 79.9% = 34,562 ÷ 43,246; top-15 US importer cumulative 18.2% = 7,869 ÷ 43,246; top-10 MX shipper cumulative 23.1% = 10,009 ÷ 43,246.
See this data live on ProduceTradeIQ
Search any company, product, or trade route. 7-day free trial.
Start Free Trial