May 8, 2026 · 8 min read
Sinaloa: Mexico's Largest Produce Export State (2026 Guide)
1 in 4 Mexican produce trucks crossing the US border come from Sinaloa. The exporters, US buyers, commodities, and border corridors that move the volume.
One in four Mexican produce trucks crossing the US border in January-February 2026 originated in Sinaloa. The single Mexican state accounted for 26.2% of all Mexican produce truck volume and $363 million in cleared US Customs declarations in the first two months of 2026 alone — almost half of which was tomatoes destined for US retail and foodservice channels.
For US produce buyers, distributors, and importers, Sinaloa isn't a regional exporter. It's the structural backbone of US winter and spring fresh-vegetable supply. This guide breaks down what Sinaloa exports, who exports it, who buys it, where it crosses, and why the Culiacán valley specifically is the geographic engine behind the operation.
Why Sinaloa Dominates Mexican Produce Exports
Sinaloa is Mexico's leading produce-exporting state by a structural margin: in Q1 2026 it was 26.2% of Mexican produce truck volume but only 12.7% of total value. The volume-vs-value gap is the most informative single statistic about what Sinaloa actually does.
The gap reflects what Sinaloa grows: high-volume, value-priced staples — tomatoes, peppers, cucumbers, squash, eggplant — for the US winter retail and foodservice market. These commodities ship in massive quantities at moderate per-truck values. The high-margin specialty crops that dominate Mexican produce value rankings come from elsewhere: avocados from Michoacán, mangoes from Nayarit and Oaxaca, berries from Jalisco's protected agriculture corridors. Sinaloa is the breadbasket; other states are the orchards and greenhouses.
Three structural factors built that breadbasket position:
Geography and irrigation. Sinaloa sits along Mexico's Pacific coast, sheltered from the cold north and warmed by Pacific currents. Three perennial river systems — the Yaqui, Mayo, and Fuerte — flow down from the Sierra Madre Occidental into a fertile alluvial coastal plain. Add the Río Culiacán watershed and Mexico's largest network of agricultural irrigation infrastructure, and Sinaloa has the year-round water supply to grow vegetables when most of Mexico (and most of the US) cannot.
Climate window. Sinaloa's growing season is exactly inverted from the major US vegetable-producing regions. While California, Florida, and the US Southeast slow or shut down field production from October through April, Sinaloa is at peak. That counter-seasonality is the entire commercial logic of the supply chain: US retailers and foodservice operators who can't run on US domestic supply during winter buy from Sinaloa.
Infrastructure investment. Decades of public and private investment in greenhouse facilities, packing houses, and the Mexico-15 highway corridor north to the US border have hardened Sinaloa as the preferred Mexican origin for US-bound vegetables. The Culiacán valley alone hosts hundreds of commercial-scale operations, and the Mazatlán-to-Nogales truck corridor has become one of the densest cold-chain logistics arteries in North America.
Culiacán alone accounts for 71% of Sinaloa's $363M Q1 export value. The Río Culiacán watershed — fed by the Yaqui, Mayo, and Fuerte river irrigation systems — is the actual production engine. Smaller hubs in Navolato, Guasave, Mazatlán, Los Mochis, and Eldorado make up the balance.
What Sinaloa Grows for the US Market
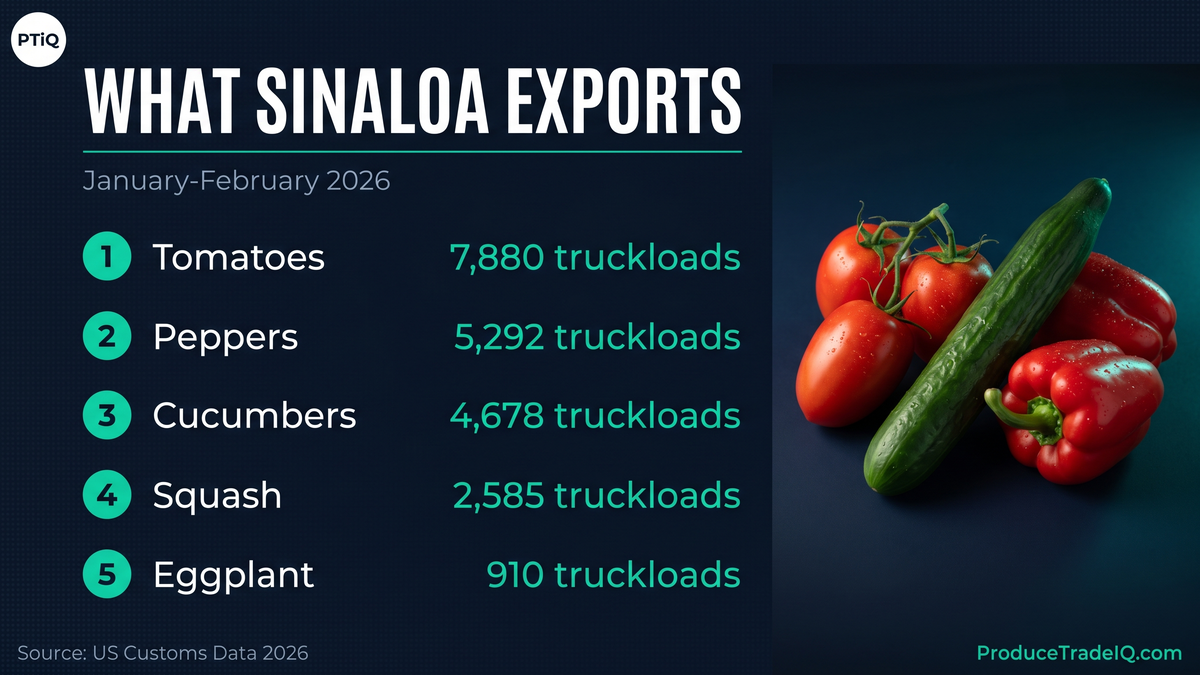
CBP shipment data for January-February 2026 shows Sinaloa exports concentrated heavily in five vegetable categories:
| Rank | Commodity | HS code | Trucks | Value (USD) | Share of Sinaloa |
|---|---|---|---|---|---|
| 1 | Tomatoes (all types) | 0702 | 7,880 | $169.8M | 47% |
| 2 | Peppers (bell + chile) | 0709.60 | 5,292 | $79.3M | 22% |
| 3 | Cucumbers | 0707 | 4,678 | $45.7M | 13% |
| 4 | Squash & gourds | 0709.9 | 2,585 | $24.4M | 7% |
| 5 | Eggplant | 0709.30 | 910 | $10.2M | 3% |
| 6 | Beans (snap/string) | 0708.20 | 399 | $8.7M | 2% |
| 7 | Mangoes | 0804.5 | 74 | $7.7M | 2% |
| 8 | Watermelons | 0807.1 | 575 | $2.6M | 1% |
| 9 | Strawberries | 0810.1 | 60 | $2.2M | 1% |
Tomatoes plus peppers plus cucumbers = 82% of Sinaloa's Q1 export value. The Sinaloa export economy is, structurally, a vegetable economy.
The tomato share alone is enormous. Sinaloa-origin tomatoes — Roma, beefsteak, cherry, vine, grape — make up nearly half of every dollar Sinaloa exports. The largest single Sinaloa exporter (Ceuta Produce) moved $31.7M of mixed product including a substantial tomato slice; the second-largest (Agricola La Primavera) is a tomato specialist at $21.2M. For the broader Mexican tomato trade context, see our top tomato importers post.
A useful honest disclosure: despite being Mexico's largest produce export state by volume, Sinaloa is only 2% of Mexican mango export value. The mango trade flows primarily through Nayarit, Michoacán, and Oaxaca — see our mango importers post for the geography of Mexican mango export, which routes east through Pharr-McAllen rather than north through Nogales.
Top Sinaloa Exporters
The supplier side is moderately concentrated. The top 10 Sinaloa exporters during January-February 2026, ranked by USD value:
| Rank | Sinaloa Exporter | Trucks | Value (USD) | US Buyers | Commodities |
|---|---|---|---|---|---|
| 1 | Ceuta Produce S de RL de CV | 2,180 | $31.7M | 1 | tom + cuc + pep + squash |
| 2 | Agricola La Primavera SA de CV | 1,008 | $21.2M | 1 | tomato specialist |
| 3 | International Greenhouse Produce SA de CV | 992 | $17.1M | 1 | tom + cuc + pep |
| 4 | Bioparques de Occidente SA de CV | 752 | $16.7M | 1 | tomato specialist |
| 5 | Agroindustrias Tombell SA de CV | 652 | $14.1M | 4 | tom + pep |
| 6 | Agroexportadora del Noroeste SA de CV | 656 | $12.7M | 3 | tomato |
| 7 | Del Campo y Asociados SA de CV | 540 | $12.0M | — | tom + cuc + pep + berries |
| 8 | Rancho Agricola Las Cabras SPR de RL de CV | 650 | $9.4M | 2 | tom + cuc + pep + watermelon |
| 9 | Agricola La Tuxcana SA de CV | 788 | $8.5M | 1 | tom + cuc + eggplant |
| 10 | Agricola Paredes SAPI de CV | 662 | $8.4M | 2 | tom + pep + eggplant |
Ceuta Produce is the structural #1 — a multi-commodity Sinaloa shipper that dominates not just locally but across categories. Ceuta is also the largest Mexican cucumber exporter in our cucumber data, with 841 cucumber-only truckloads in the same window — see the cucumber importers post for the full Mexican cucumber export ranking. Agricola La Tuxcana appears as the #3 Mexican cucumber exporter in the same data. Bioparques de Occidente is referenced in our top tomato importers post as a major tomato specialist.
The single-buyer pattern — most top exporters supplying just one US importer — reflects the integrated grower-shipper-buyer model common in Mexican produce: a Sinaloa packing house tied contractually or by ownership to a specific US distribution arm.
Top US Importers Sourcing from Sinaloa
The buyer side is similarly concentrated at the top:
| Rank | US Importer | Trucks | Value (USD) | Sups | Commodity mix |
|---|---|---|---|---|---|
| 1 | Farmer's Best International LLC | 1,413 | $20.8M | 6 | tom + cuc + pep + squash + eggplant |
| 2 | Kaliroy Fresh LLC | 812 | $17.6M | 2 | tomato |
| 3 | Marengo Foods Company LLC | 957 | $16.3M | 5 | tom + pep + squash |
| 4 | SL Produce LLC | 469 | $7.9M | 10 | tom + cuc + pep + beans |
| 5 | Five Crowns Marketing | 270 | $6.3M | 1 | other vegetables |
| 6 | BJ Brothers Produce | 491 | $6.3M | 1 | tom + cuc + pep + watermelon |
| 7 | Sierra Solutions Inc | 293 | $5.8M | 6 | tom + cuc + pep |
| 8 | Comarca Fresh LLC | 299 | $4.8M | 5 | tom + cuc + pep + eggplant |
| 9 | Ideal Harbest LLC | 172 | $4.2M | 4 | broad mix |
| 10 | BJ Bailey Farms Inc. | 105 | $3.7M | 1 | tom + pep |
Most of these names will be familiar to anyone reading the broader May arc:
- Farmer's Best International LLC is the #1 Mexican cucumber importer in the cucumber post and the #6 mango importer in the mango post — a Nogales, Arizona operation built around Sinaloa-corridor sourcing.
- Kaliroy Fresh LLC is the #1 US tomato importer in the tomato post.
- Marengo Foods and Sierra Solutions also rank in the top 5 of the tomato post.
- SL Produce LLC and Comarca Fresh LLC are top-tier cucumber importers.
The structural takeaway: the importers who matter most for Mexican-vegetable procurement are mostly the same set, with different commodity mixes. A buyer building a Sinaloa-origin program is competing with a small group of well-capitalized, vertically-integrated incumbents — and the data shows exactly who they are.
How Sinaloa Product Reaches the US: Nogales vs Pharr
| Mexican Border State | Trucks | Value (USD) | Share | US Port of Entry |
|---|---|---|---|---|
| Sonora | 15,936 | $226.9M | 62.5% | Nogales, AZ |
| Tamaulipas | 6,603 | $117.8M | 32.5% | Pharr / McAllen, TX |
| Baja California Norte | 690 | $17.3M | 4.8% | Otay Mesa / San Ysidro, CA |
| Chihuahua | 69 | $1.0M | 0.3% | Ojinaga / Presidio, TX |
Sinaloa primarily routes through Nogales (62.5% by value) — the inverse of Mexican mango's Pharr-dominance. The Pacific corridor — Mexico's Federal Highway 15 connecting Culiacán north through Sonora to the Mariposa cargo facility at Nogales — has been the structural Sinaloa export route since the 1960s.
Tamaulipas's 32.5% share comes mostly from Sinaloa shippers using the cross-Mexico inland route via Reynosa-Pharr to reach east-coast US distribution. The choice between Nogales and Pharr is increasingly about destination market: Sinaloa product bound for California, the Pacific Northwest, and Mountain West typically routes via Nogales; Sinaloa product bound for Texas, the Southeast, and East Coast typically routes via Pharr.
For the underlying customs declaration documentation, every Sinaloa truck filing has a matching Mexican Pedimento on the south side and an ACE entry summary on the US side — see our CBP AMS data explainer for the four customs systems behind the data.
Sinaloa's Production Calendar
Sinaloa's commercial export season runs October through May, with peak volume in January through March. This calendar is structurally aligned with US winter when domestic production is at its lowest:
- October-November: Early winter ramp. Tomato and pepper greenhouse operations start commercial shipping; cucumber and squash field production begins.
- December-January: Volume peaks early. Holiday retail demand pulls heavy tomato and pepper volume.
- February-March: Peak season. Highest weekly truck counts. Maximum diversity of commodity mix. Best supplier availability. The two months of CBP data anchoring this guide are the heart of this window.
- April-May: Volume tapers as US domestic California, Florida, and Mexican-other-states production scales up.
- June-September: Sinaloa field production largely done; greenhouse operations continue at lower volume; US sources dominate.
Buyers planning a Sinaloa-origin program should commit volume contracts before October to lock in capacity at the right shippers — by November the major Sinaloa packing houses are largely committed for the season. For pricing context during the window, see how FOB SC pricing works in the produce industry — every Sinaloa truckload that crosses into Nogales or Pharr gets a USDA Market News FOB SC quote at the US-side shipping point.
How to Track Sinaloa Suppliers
ProduceTradeIQ surfaces every shipment-level CBP record from Sinaloa across truck, sea, and air modes — though Sinaloa is overwhelmingly truck. For Sinaloa specifically, you can:
- Search Sinaloa exporters directly. Filter Competitor Intel by Mexican shipper name or address keyword to surface every active Sinaloa shipper for your target commodity.
- Browse the long tail. The 10 exporters in the table above are the largest, but there are 233 more Sinaloa-origin exporters in the Q1 2026 dataset — that's where open relationships live.
- Cross-check supplier-buyer relationships. Each importer profile shows their Sinaloa supplier base. Spot which growers are tied to which buyers — and which aren't.
- Track shipment frequency by week. A consistent weekly shipper beats a sporadic one. Shipment records show every individual crossing date and weight.
- Monitor port-routing changes. A buyer shifting volume from Nogales to Pharr is signaling a logistics or supplier change.
Getting Started
Sinaloa is the structural origin of one in four Mexican produce trucks crossing the US border in winter and spring. If your category includes tomatoes, peppers, cucumbers, squash, or eggplant, your competitors are sourcing from Sinaloa — and the platform shows you exactly which Sinaloa shippers and which US buyers move that volume.
Start your free trial on ProduceTradeIQ to search Sinaloa exporters, see who's importing from where, and track FOB USDA prices at Nogales and McAllen FOB SC. No credit card required.
Data sources: CBP-derived shipment records via the ProduceTradeIQ platform (mx_shipments table), filtered by shipper_address containing "SINALOA" — 18,366 raw records, 245 unique exporters, January-February 2026 window. Truckload counts derived from line-item kilograms divided by 22,000 kg standard refrigerated trailer payload. USD values are sums of CBP-reported invoice values. Broker placeholders and aggregator entities flagged in the ProduceTradeIQ audit are excluded.
See this data live on ProduceTradeIQ
Search any company, product, or trade route. 7-day free trial.
Start Free Trial