May 20, 2026 · 8 min read
Texas Border Crossings for Mexican Produce: Pharr, Laredo, Roma
Where Mexican produce actually crosses into Texas — Pharr leads with 60.9%, Laredo's avocado-berry corridor follows, Roma quietly handles specialty volume.
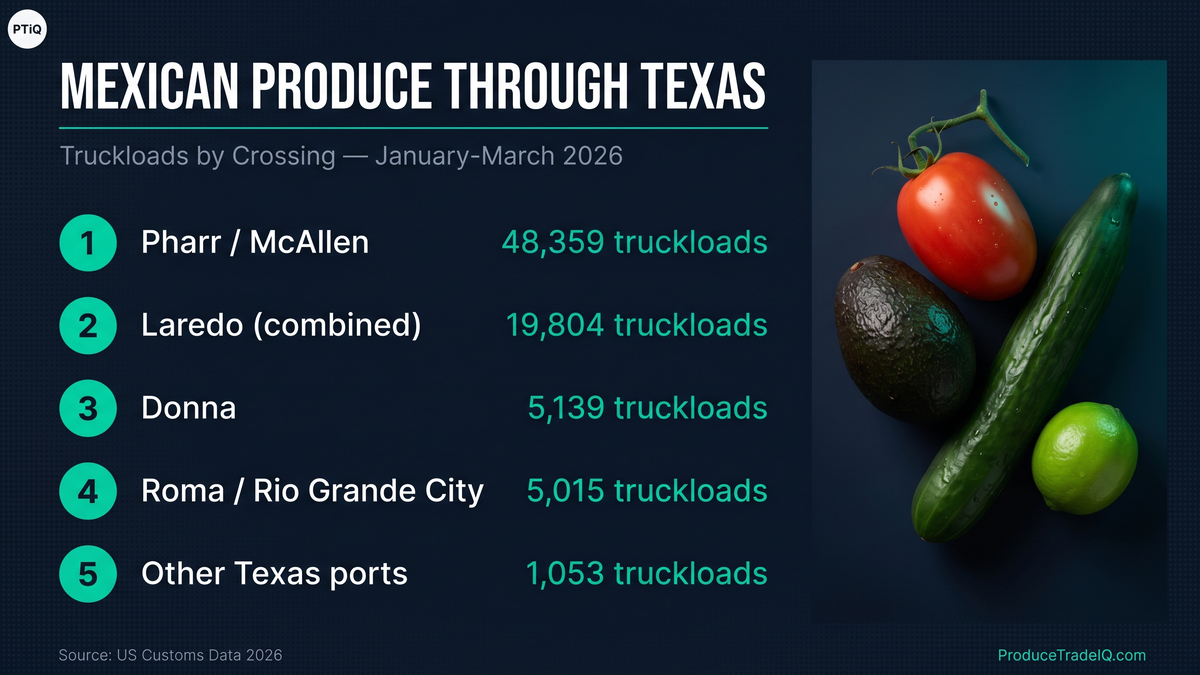
Texas handles 54.7% of all Mexican produce trucks crossing into the US — 79,356 truckloads in January-March 2026 (Q1 2026, three-month window), distributed across nine Texas ports of entry. But the volume isn't even remotely evenly distributed. Pharr-McAllen takes 60.9% of the Texas total (48,359 ÷ 79,356 = 60.9%). Laredo (combining its two bridges) takes 25.0% (19,804 ÷ 79,356). The other seven Texas ports collectively handle the remaining 14%.
Where you cross matters because it determines what's sourced, who's buying, and how the supply chain is structured. Tomatoes and cucumbers run through Pharr; avocados and berries run through Laredo; specialty mixed-vegetable buyers operate out of Roma; and Eagle Pass — despite the booming-port narrative in trade press — handles essentially zero produce. This guide maps the real Mexican-produce-to-Texas corridor structure with primary CBP data.
The Texas Crossing Map
Nine US Texas ports receive Mexican produce trucks. Five of them carry meaningful volume:
| Rank | Texas Port | Mexican Border City | Trucks | Value (USD) | Share of TX |
|---|---|---|---|---|---|
| 1 | Pharr / McAllen | Reynosa | 48,359 | $1.62B | 60.9% |
| 2 | Laredo (combined two bridges) | Nuevo Laredo + Colombia (NL) | 19,804 | $1.33B | 25.0% |
| 3 | Donna | Las Flores (Rio Bravo) | 5,139 | $29M | 6.5% |
| 4 | Roma / Rio Grande City | Miguel Alemán + Camargo | 5,015 | $113M | 6.3% |
| 5 | El Paso | Ciudad Juárez | 837 | $112M | 1.1% |
| 6 | Presidio | Ojinaga (Chihuahua) | 151 | $7M | 0.2% |
| 7 | Eagle Pass | Piedras Negras (Coahuila) | 28 | $5M | 0.04% |
| 8 | Brownsville | Matamoros | 23 | $58K | 0.03% |
| 9 | Del Rio | Ciudad Acuña (Coahuila) | 14 | $3M | 0.02% |
Texas total: 79,356 trucks at $3.21B value. The non-Texas Mexican crossings (Nogales AZ, Otay Mesa CA, Columbus NM, Otay Mesa + Calexico CA) account for the other 65,653 trucks. Combined, all four Tamaulipas-side Texas crossings (Pharr + Donna + Roma + Brownsville) handle 73.8% of Texas produce volume (58,536 ÷ 79,356 = 73.8%) — Tamaulipas is the dominant Mexican origin state for east-corridor produce.
Pharr / McAllen: The Produce Volume Leader
Pharr-McAllen carries 48,359 produce trucks (60.9% of Texas — 48,359 ÷ 79,356 — and 33.3% of all Mexican produce in the Q1 2026 window — 48,359 ÷ 145,009) — every other Texas crossing combined is smaller. Pharr-Reynosa International Bridge is the produce-specialized commercial corridor: cold-storage infrastructure built for it, USDA inspection capacity tuned for high-volume reefer throughput, dense importer-distributor networks within ten miles of the bridge.
For the deep dive on Pharr-McAllen — how the cold-chain infrastructure works, who the major distributors are, the Pharr Produce District ecosystem — see our McAllen-Pharr Texas port guide. The new Texas-corridor analysis here defers to that post for Pharr-specific detail and focuses on what's genuinely under-covered in the corpus: Laredo, Roma, and the myth-busting Eagle Pass story.
Laredo: The Avocado, Strawberry, and Greenhouse Brand Port
Laredo's two bridges — the Laredo World Trade Bridge (Nuevo Laredo crossing, 11,782 trucks) and the Colombia Solidarity Bridge (via Colombia, Nuevo León, 8,022 trucks) — together handle 19,804 produce trucks at $1.33 billion in Jan-Mar 2026. That's 25.0% of Texas produce by volume (19,804 ÷ 79,356) but 41% by value ($1.33B ÷ $3.21B) — Laredo punches above its weight on per-truck value because of what crosses there.
The Laredo commodity mix is fundamentally different from Pharr's:
| HS4 | Category | Trucks | Value (USD) |
|---|---|---|---|
| 0804 (HS 080440) | Avocados | 7,652 | $364M |
| 081010 + 081020 | Berries (strawberries + raspberries / blackberries) | 3,208 | $406M |
| 0702 | Tomatoes | 2,904 | $196M |
| 0709.60 | Peppers | 1,615 | $99M |
| 0707 | Cucumbers | 713 | $38M |
Avocados alone are 38.6% of Laredo produce volume (7,652 ÷ 19,804 = 38.6%). Laredo is the avocado superhighway — Michoacán-grown Hass avocados truck the inland route up Federal Highway 57 to Nuevo Laredo and cross into Texas at Laredo, then redistribute east via I-35 toward Dallas, Houston, and the Southeast. The Pharr corridor barely sees avocado traffic because the routing geography doesn't favor it.
The buyer roster reflects this commodity mix. Laredo's top importers in Jan-Mar 2026 split into two camps: avocado specialists (Henry Avocado Corporation 554 trucks, West Pak Avocado 192 trucks combined across LLC variants, Fronterra Group 118 trucks, Del Monte Fresh Produce 725 trucks combined across three name variants, and Mission Produce Inc 281 trucks as a new arrival at #6 on the combined Laredo table — Mission is NASDAQ-listed and the world's largest avocado distributor); and branded greenhouse vegetable operations (NS Brands / NatureSweet 997 trucks combined, Mastronardi/Sunset 705 trucks combined across International + Limited variants, Nature Fresh Farms 344 trucks combined across LLC variants). GAB Operations LLC is the notable Q1 2026 new arrival at Laredo — 520 trucks in the three-month window, putting them #4 by single-variant truck count just ahead of Mastronardi's lead variant. Their commodity mix doesn't fit cleanly with either the avocado specialists or the branded greenhouse vegetable camp; specific analysis is beyond the scope of this corridor guide. The avocado importers are largely distinct from the cucumber / tomato / pepper community we've documented elsewhere in this corpus — avocado deserves its own treatment, with an importer roster and corridor structure that don't overlap with the May arc's existing posts.
NS Brands at Laredo is consistent with their cucumber post #5 ranking — they run mixed-vegetable programs (tomato + cucumber + pepper) across multiple corridors. Mastronardi/Sunset shows up in the cucumber post and the existing tomato post; Laredo is one of their primary US-side gateways for branded greenhouse tomato. Tomato volume at Laredo (2,904 trucks in Q1 2026) is substantial — confirming Laredo as a meaningful tomato corridor in addition to its avocado dominance.
The Colombia Solidarity Bridge contribution (8,022 trucks via Nuevo León) is a useful operational detail. Colombia is the only US-Mexico land port without a city on either side — it was built in 1991 specifically to relieve commercial congestion at Laredo's other bridges, and many high-value loads route there for faster crossing times. For Laredo-bound buyers, "Colombia or World Trade?" is a real operational question.
Roma / Rio Grande City: The Under-Covered Specialty Crossing
Roma-Miguel Alemán Bridge plus Camargo-Rio Grande City together carry 5,015 produce trucks at $113 million in Jan-Mar 2026 — 6.3% of Texas produce (5,015 ÷ 79,356 = 6.3%), the #4 Texas crossing. Q1 2026 volume nearly doubled from the Jan-Feb baseline (+96%) as March-peak Tamaulipas onion, melon, and brassica seasonality ramped through the mid-Valley corridor. Hard to find in any existing produce-trade coverage. Worth surfacing.
The commodity mix is specialty / diversified, distinct from any other Texas port:
| HS4 | Category | Trucks |
|---|---|---|
| 0709.9x | Squash & gourds | 1,008 |
| 0709.60 | Peppers | 917 |
| 0703.10 | Onions | 789 |
| 0704.9x | Cabbage / kale / brassica variants (excl. cauliflower) | 716 |
| 0702 | Tomatoes | 352 |
| 0706.10 | Carrots | 298 |
| 0807.11 | Watermelons | 112 |
No single commodity dominates. Roma is the mid-Valley specialty corridor — smaller-scale loads with broader per-buyer commodity mixes. The Tamaulipas onion volume that the onion importers post attributed entirely to Pharr at the Mexican-state level actually splits across Pharr, Roma, and Donna at the city level; Roma alone moved 789 onion trucks in the Q1 2026 window, nearly matching Pharr's 800.
The Roma importer roster has shifted meaningfully in Q1 2026. Mirasoles Produce USA LLC now leads at 733 trucks (#1), ahead of Wah Teng Produce LTD at 485 trucks and Nowell Borders L.P. at 386 trucks. Nowell Borders — the Texas-based onion-and-mixed-vegetable specialist that ranks #3 in our onion importers guide and #7 in our watermelon importers guide — sits at #3 by Q1 truck count but remains a structural cross-Texas-port specialist. Sweet Seasons LLC (#9 at Roma with 93 trucks) appears in the cucumber post and the Sinaloa export guide. The rest of the Roma top ten — A Medrano Produce (217 trucks), Coast Tropical Inc. (216), 7 Palmas Produce (179), Triple J Fresh (156), Lange Fresh Sales (117) — are family-business mid-Valley wholesalers running diversified specialty programs.
For buyers running mixed-vegetable / Hispanic-foodservice / ethnic-retail programs, Roma is the corridor that matches the channel. Higher per-load specialty mix, smaller average load size, broker community concentrated in Rio Grande City and McAllen-area suburbs.
Donna and the Mid-Valley Alternatives
Donna handles 5,139 produce trucks via the Donna-Rio Bravo International Bridge, with the Mexican-side custom port at Las Flores (Rio Bravo, Tamaulipas). Q1 2026 volume nearly doubled from Jan-Feb (+91%) on the same March Tamaulipas seasonal ramp that lifted Roma. Volume-wise Donna is similar to Roma but the commodity mix skews more toward seasonal and lower-value loads — the Donna bridge processes faster but hosts less downstream importer infrastructure than Pharr or Laredo. For buyers, Donna is typically a Pharr-overflow corridor rather than a destination crossing.
The other mid-Valley auxiliaries — Brownsville (23 produce trucks at $58K, the near-zero pattern essentially unchanged from Jan-Feb), Camargo-Rio Grande City standalone (already counted in Roma) — are operationally minor for produce. Brownsville is structurally not a produce port despite being a major commercial bridge for manufacturing and auto-parts. If you're researching Brownsville for produce, the data shows there's no produce there to research.
Eagle Pass: A Manufacturing Port, Not a Produce Port
You may have read trade-press headlines about Eagle Pass becoming the next major US-Mexico commercial port. For produce, that's not what's happening. Our window: Eagle Pass = 28 produce trucks across 13 customs declarations. 0.04% of Texas produce volume (28 ÷ 79,356 = 0.04%). Adding Del Rio (Ciudad Acuña, also Coahuila) brings the combined Coahuila-side total to 42 trucks. That is essentially zero produce.
Where Eagle Pass is booming is manufacturing and auto-parts — Coahuila auto plants (Ramos Arizpe / Saltillo), Union Pacific Eagle Pass rail expansion, BNSF Falcon Yard near Eagle Pass servicing high-volume intermodal traffic, plus growing US-Mexico auto-supply integration tied to USMCA. None of those drivers move produce. The buyer-research implication: if you're sourcing Mexican produce, skip Eagle Pass and focus on Pharr, Laredo, and Roma. The Eagle Pass commercial growth narrative applies to a different industry.
This is a buyer-research point worth surfacing because the "Eagle Pass is the next big port" framing has leaked into produce-industry trade-press coverage where it doesn't belong. The data is clear: 28 trucks per three months is a rounding error.
Eagle Pass produce data is 100% Pedimento-anchored on the Coahuila-side custom port. See our CBP AMS data explainer for how the four customs systems behind US produce trade work — Eagle Pass is the cleanest case for "manufacturing routes here; produce doesn't."
How to Choose the Right Texas Crossing
Match the commodity to the corridor:
- Tomatoes, cucumbers, peppers, mango → Pharr / McAllen. The mainstream Mexican-vegetable corridor with the highest cold-chain and broker density. See our McAllen guide for the deep dive.
- Avocados → Laredo. The Michoacán-Hass corridor. Henry Avocado, West Pak, Fronterra, Del Monte all primary-route through Laredo. Pharr handles minimal avocado volume.
- Strawberries → Laredo. Jalisco and Guanajuato strawberry production routes via the inland highway to Nuevo Laredo. Distinct from the California-domestic strawberry supply chain.
- Branded greenhouse tomato/cucumber/pepper (Mastronardi / Sunset, Nature Fresh, NatureSweet) → Laredo + Pharr. Brands operate dual-corridor sourcing.
- Specialty / mixed-vegetable / ethnic-retail programs → Roma / Rio Grande City. Smaller-scale specialty buyers, family-business broker community, broader per-load commodity mix.
- Onions → Pharr and Roma now run roughly equal in the Q1 2026 window, with minimal Laredo. The onion data refines the onion post's "92% Pharr at the Mexican-state level" finding to "the volume actually splits Pharr-Roma-Donna at the city level, with Pharr and Roma running essentially tied at ~800 trucks each."
- Lime (Persian/Tahiti and Key) → Pharr. Tamaulipas-routed Veracruz/Michoacán production reaches Pharr via central-Mexico corridors. See the lime cultivar guide for the cultivar split.
- Anything from Coahuila or northern Nuevo León production → Laredo Colombia Bridge. The Colombia Solidarity Bridge specifically serves northern-state production flows.
- Skip for produce: Eagle Pass, Del Rio, Brownsville, Presidio. Total combined volume is <1% of Texas produce.
For pricing context across Texas crossings, see our FOB SC vs Incoterms FOB explainer — every Texas crossing produces a separate USDA Market News FOB SC quote at the US-side shipping point, and Pharr's daily quotes are the most-referenced benchmark.
Getting Started
Texas is the busy half of the US-Mexico produce corridor. Pharr leads, Laredo follows, Roma quietly handles specialty volume, Eagle Pass doesn't matter for produce — and the buyer-supplier ecosystem at each crossing is structurally distinct.
Start your free trial on ProduceTradeIQ to filter shipments by Texas crossing, see who's buying through Laredo vs Pharr vs Roma, and track USDA FOB prices at each shipping point. No credit card required.
Data sources: CBP-derived shipment records via the ProduceTradeIQ platform (mx_shipments table). Window: January 1 – March 31, 2026 (Q1 2026, three-month window). Texas-port attribution derived from custom_port_state field mapping Mexican border cities to corresponding US Texas ports of entry. Truckload counts derived from line-item kilograms divided by 22,000 kg standard refrigerated trailer payload. USD values are sums of CBP-reported invoice values. Broker placeholders and aggregator entities flagged in the ProduceTradeIQ audit are excluded. Concentration percentages computed as count ÷ window total; Pharr share of TX 60.9% = 48,359 ÷ 79,356; Tamaulipas-side share 73.8% = 58,536 ÷ 79,356; avocado share of Laredo 38.6% = 7,652 ÷ 19,804.
See this data live on ProduceTradeIQ
Search any company, product, or trade route. 7-day free trial.
Start Free Trial