May 5, 2026 · 7 min read
Top Mango Importers in the USA 2026
US mango imports run from Mexico (winter Ataulfo peak) plus Ecuador, Peru, and Vietnam. Top US buyers, border ports, varieties, and how to track CBP data.
The United States imports more fresh mangoes than it grows by orders of magnitude — domestic production is concentrated in a few hundred acres of Florida, while imports run into the millions of cartons every month. In the first two months of 2026 alone, US Customs (CBP) shipment records show roughly $44.6 million of fresh mango cleared the southern border, distributed across 760 estimated truckloads, 74 US importers, and 83 Mexican exporters — with the early-2026 origin mix running 94% Mexican by value. The remaining 6% arrived by sea from Vietnam, India, Colombia, and Ecuador.
The picture changes by month. Mexico dominates winter and early spring through truck shipments via the Pharr-McAllen corridor in Texas. Ecuador, Peru, Brazil, and Haiti each fill specific seasonal windows the rest of the year. Variety dominance shifts in lockstep — Ataulfo (the golden honey mango) leads winter, while Tommy Atkins, Kent, and Keitt take over in summer. For US buyers, distributors, retail produce departments, and snack-foodservice procurement teams, knowing which variety crosses which border at which port in which month is foundational sourcing intelligence.
Who Are the Top US Mango Importers?
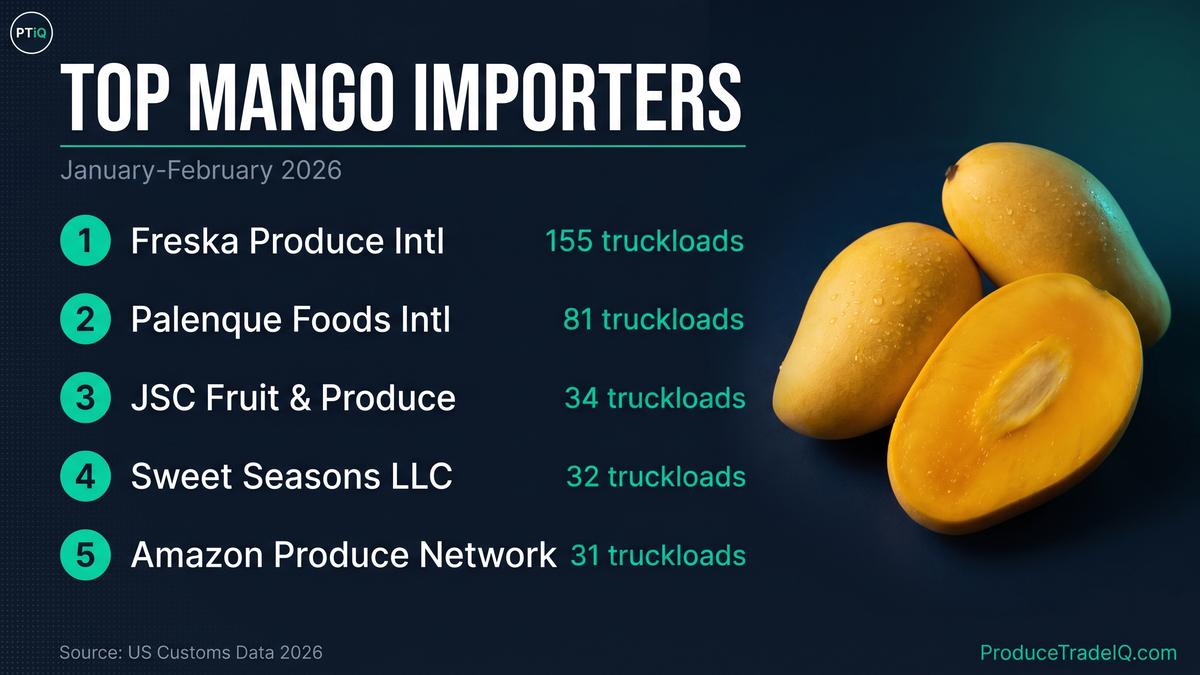
Ranked by total US dollar value of CBP-cleared mango shipments in January-February 2026 (after consolidating LLC name variants and excluding broker/aggregator placeholders), the top ten US mango importers are:
| Rank | US Importer | Truckloads | Decl. | Value (USD) | Notes |
|---|---|---|---|---|---|
| 1 | Solely International Inc | 15 | 61 | $5.17M | freeze-dried snack brand |
| 2 | Freska Produce International LLC | 155 | 26 | $4.97M | top fresh-mango volume |
| 3 | Mariani Packing Co Inc. | 9 | 17 | $2.90M | dried mango — high $/truck |
| 4 | Palenque Foods International LLC | 81 | 17 | $2.64M | fresh, top Mexican supplier |
| 5 | Sunset Fine Foods LLC | 9 | 14 | $2.22M | premium / processed |
| 6 | Amazon Produce Network LLC | 31 | 8 | $2.03M | fresh |
| 7 | Sweet Seasons LLC | 32 | 18 | $1.70M | fresh, 5 supplier base |
| 8 | Garabato Produce LLC | 14 | 6 | $0.87M | fresh |
| 9 | Hand Shake Farms Inc. | 3 | 4 | $0.83M | high $/truck |
| 10 | JSC Fruit and Produce LLC | 34 | 33 | $0.78M | fresh, single supplier |
Methodology: Truckload count is the sum of CBP line-item kilograms (qty1 where uom1 = KGM) divided by 22,000 kg per refrigerated trailer. Customs declarations is the count of distinct entry filings; one declaration usually bundles multiple physical truckloads. USD value is the sum of value_usd from CBP records. Names with multiple LLC casing variants (e.g. Freska Produce International LLC + Freska Produce Int. LLC.) are consolidated. Broker placeholders and aggregator entities flagged in the ProduceTradeIQ audit are excluded.
A critical detail: this table mixes fresh and dried mango. Solely International, Mariani Packing, and Sunset Fine Foods all show $/truck ratios above $200,000 — telling you those loads are processed product (freeze-dried, dehydrated, premium retail) rather than spot-market fresh fruit. Freska Produce International at $4.97M across 155 truckloads runs at a more typical $32K/truck — that is the fresh-mango benchmark. We disentangle this in §4.
Freska Produce International LLC, headquartered in Oxnard, California, is the largest fresh mango importer by truckload volume in this window. Palenque Foods International LLC runs an integrated grower-importer model out of Texas, sourcing primarily from Grupo Agricola El Palenque (visible in our supplier-side data). Amazon Produce Network LLC — based in New Jersey, no relation to the e-commerce platform — handles a diverse mix of varieties. Sweet Seasons LLC maintains the most diversified Mexican supplier base in the top ten (5 distinct shippers across 32 truckloads).
Why Pharr-Tamaulipas Dominates Mango Imports (Not Nogales)
CBP shows the Mexican mango supply chain runs east, not west:
| Mexican Border State | Truckloads | Value (USD) | Share | US Port of Entry |
|---|---|---|---|---|
| Tamaulipas | 491 | $27.4M | 64.5% | Pharr / McAllen / Hidalgo, TX |
| Sonora | 234 | $8.6M | 20.2% | Nogales, AZ |
| Baja California Norte | 35 | $5.6M | 13.2% | Otay Mesa / San Ysidro, CA |
| Chihuahua | 2 | $370K | 0.9% | Ojinaga / Presidio, TX |
Two out of every three mango truckloads from Mexico cross at the Pharr-Reynosa International Bridge — the opposite of cucumber's Sonora-dominant pattern (see our cucumber importers post for the cucumber corridor breakdown, where Nogales handles 65% of volume).
The geographic logic is straightforward. Mexican commercial mango production is concentrated in Sinaloa, Nayarit, Michoacán, Oaxaca, Veracruz, Guerrero, and Chiapas — the western-Pacific and central-southern states. From Sinaloa northward, shippers have two routes: the long Pacific-coast haul up through Sonora to Nogales, or the cross-country east-southeast haul to Tamaulipas and into Pharr. The latter is shorter for shippers in Nayarit and points south, faster for refrigerated mango in transit (especially Ataulfo, which is more delicate than Tommy Atkins), and connects directly to I-2 / I-69 distribution out of South Texas. Pharr-Reynosa has invested heavily in cold-chain throughput and USDA agricultural inspection capacity over the last decade specifically to handle this kind of southern-Mexican produce flow.
Sonora's 20% share comes from northwestern-state production (Sinaloa-routed via the Pacific corridor) plus operations near Sonora itself. Otay Mesa's 13% reflects greenhouse and Baja California production routed through California — high $/truck (avg ~$160K/truck) suggests premium or organic positioning. Chihuahua is a rounding error.
For more detail on the differences between US ports of entry, see our guides on the McAllen-Pharr Texas port and the Nogales, Arizona produce import corridor.
Mango Varieties: A Calendar, Not a List
Cucumber varieties (slicing, Persian, English, mini, pickling) coexist year-round across origins. Mango varieties run on a calendar. What ships in January is not what ships in July — and the top importers' procurement schedules reflect that.
Visible in the January-February 2026 mx_shipments product descriptions:
- Ataulfo (also: Manila, Honey, Champagne): 233 truckloads — the dominant winter variety. Small, flat, kidney-shaped, golden-yellow skin, smooth deep-orange flesh, minimal fiber. Mexican production runs December through July with peak January through April. The varietal that retail "mango bag" programs are typically built around.
- Tommy Atkins: 89 truckloads (under "Tommy" + "Tomy" spellings). The workhorse of the global mango trade. Fibrous, hardy, ships well; less flavorful than Ataulfo but tolerant of long supply chains. Mexican peak March through August; also imported from Ecuador, Peru, Brazil in their respective seasons.
- Haden: 21 truckloads. The variety nearly every other commercial mango is descended from. Mexican peak March through May. Limited US import volume but visible in January-February tail-end shipments.
- Criollo (creole / native): 47 truckloads. A catch-all for traditional Mexican landraces — primarily destined for Mexican-American specialty retail and foodservice channels.
- Marathon: 11 truckloads. Branded program (Mexican shipper-side label, primarily Ataulfo).
Absent from January-February 2026 data: Kent and Keitt. These are the late-season Mexican varieties — Kent peaks May through August, Keitt June through September. They appear in CBP records starting around April. Together with Tommy Atkins, they fill the gap between Ataulfo's spring tail and the start of the South American sea-trade window.
For a sourcing professional, the implication is that supplier diversification cannot be planned by region alone — it has to be planned by variety-month. A retail mango program needs Ataulfo from Mexico in winter, Tommy Atkins from Mexico-then-Ecuador-then-Peru in summer-fall, and Kent and Keitt from Mexico in mid-summer to maintain consistent volume.
Fresh vs. Dried: The Hidden Mango Pipeline
The combined CBP value table at the top of this post mixes fresh and dried mango under the same HS subline (0804.50). Backing the data out, the dollars-per-truckload ratio is the cleanest signal of which is which:
| Importer | Trucks | Value | $/Truck (approx) | Inferred channel |
|---|---|---|---|---|
| Freska Produce International | 155 | $4.97M | $32K | fresh |
| Palenque Foods International | 81 | $2.64M | $33K | fresh |
| JSC Fruit and Produce | 34 | $0.78M | $23K | fresh |
| Sweet Seasons | 32 | $1.70M | $53K | fresh / mixed |
| Solely International | 15 | $5.17M | $345K | freeze-dried snacks |
| Mariani Packing | 9 | $2.90M | $322K | dried fruit retail |
| Sunset Fine Foods | 9 | $2.22M | $247K | premium / processed |
A 22,000-kg truckload of fresh Mexican Ataulfo at FOB origin runs roughly $25K-$45K depending on grade and timing. Anything north of $100K/truck is processed (dried, freeze-dried, pulp, puree) where weight-to-value collapses by an order of magnitude.
The supplier-side data confirms this. Mariani Sunset CECA MX SPR de RL (a Mexican shipper) appears as a top-five Mexican mango exporter at $2.9M / 9 truckloads — feeding directly into Mariani Packing Co Inc on the US side. The pipeline is contractually integrated: a single shipper, a single buyer, a single product line (Mariani Premium dried mango). Bees Deshidratados S de RL de CV ("deshidratados" = dehydrated) shows up at $2.1M / 8 truckloads with a similar pattern.
For US buyers, the takeaway is that the mango trade isn't one market — it is at least two:
- Fresh-fruit retail and foodservice (Freska / Palenque / Sweet Seasons) — high-volume, lower-margin, Mexico-centric in winter, multi-origin in summer.
- Dried and processed retail (Mariani / Solely / Sunset Fine Foods) — lower-volume, higher-margin, dominated by Mexican processing capacity (Sinaloa, Oaxaca, Michoacán dehydration plants).
These two markets compete for some of the same Mexican fruit at first ranch but diverge entirely on pricing, contracting, and channel economics.
The Multi-Origin Mango Calendar
January-February 2026 looks like a Mexican monoculture in our shipment data, but the year-round picture is multi-origin. The standard industry calendar:
- Mexico — January through September (peak March through August): Ataulfo December-July, Tommy Atkins March-August, Kent May-August, Keitt June-September, Haden March-May. Mexico's commercial production states are arranged in a south-to-north harvest progression, so volume rolls northward through the year.
- Ecuador — September through January: Tommy Atkins, Kent. Major sea-trade supplier filling the early-fall through winter window. Annual 2025 zari sea-trade data shows Ecuador at $164.5M of cleared mango — by far the largest non-Mexican origin.
- Peru — December through March: Kent, Edward, Tommy Atkins. Counter-seasonal supplement to Mexico's Ataulfo peak. Underrepresented in our January-February 2026 zari window but a known major US supplier.
- Brazil — August through November: Tommy Atkins, Palmer, Kent. Fills the late-Mexico to early-Ecuador transition.
- Haiti — March through August: Madame Francis (Francique). Specialty Caribbean variety, primarily Northeast US ethnic-retail channel.
- Vietnam — winter window (emerging): Visible in our January-February 2026 zari data at $2.26M / 220 sea shipments — the largest non-Mexican origin in this specific window. Volume reflects the post-2019 USDA approval of irradiation-treated Vietnamese fresh mango (varieties: Cát Hòa Lộc, Cát Chu).
Buyers planning a year-round mango program need to commit to suppliers in at least three of these origins to maintain consistent volume — Mexico anchors winter and the summer-Mexico variety mix, Ecuador or Peru fill fall-winter sea trade, and Brazil bridges August through November. For Mexican-only winter programs (Mexican-American retail, restaurant chains anchored on Ataulfo), Mexico is sufficient January through July.
Top Mexican Mango Exporters
Value-ranked supplier side from mx_shipments, January-February 2026:
| Rank | Mexican Exporter | Trucks | Value (USD) | Decl. | US Buyers |
|---|---|---|---|---|---|
| 1 | Frutas Premium SA de CV | 71 | $4.7M | 8 | 1 |
| 2 | Fruitex de Mexico SAPI de CV | 12 | $4.2M | 50 | 1 |
| 3 | Mariani Sunset CECA MX SPR de RL | 9 | $2.9M | 17 | 1 |
| 4 | Operadora La Fara SA de CV | 9 | $2.2M | 14 | 1 |
| 5 | Bees Deshidratados S de RL de CV | 8 | $2.1M | 10 | 3 |
| 6 | Comercializadora Fruticola de Oaxaca SA de CV | 63 | $2.0M | 10 | 4 |
| 7 | Frutopica SA de CV | 18 | $1.7M | 8 | 1 |
| 8 | Grupo Agricola El Palenque SA de CV | 44 | $1.7M | 9 | 1 |
| 9 | Instantia GS SA de CV | 5 | $1.6M | 10 | 2 |
| 10 | Sweeter Exportadora SPR de RL | 26 | $1.4M | 8 | 1 |
The single-buyer concentration is even more pronounced than on the cucumber side: nine of the top ten Mexican mango exporters supply exactly one US importer at scale. This is the integrated grower-shipper-buyer model in practice — Mexican production dedicated to a specific US distribution arm, often through long-running ownership or contractual relationships. (Mariani Sunset CECA MX → Mariani Packing is the pipeline visible in this data.)
For US buyers attempting to break into the category, the long tail (the 73 other Mexican mango exporters in our January-February 2026 window) is where the open relationships are. Top exporters are typically already locked into their US partners.
How to Find Mango Suppliers
Practical approach using trade data:
- Identify top importers in your target market. Use Competitor Intel to search for mango importers. Filter by truckload volume, by city or state, or by border port.
- Look at supplier relationships. Each importer's profile shows their top Mexican (or Peruvian, Ecuadorian) suppliers — which growers and packers maintain ongoing trade with established US buyers.
- Track shipment frequency. A supplier shipping consistently every week or two beats one with sporadic activity. Check mango shipment records to see individual crossings, dates, weights, and customs ports.
- Match origin and variety to season. Ataulfo Mexico is winter. Tommy Atkins is summer Mexico-Ecuador-Peru-Brazil rotation. Kent and Keitt are mid-summer Mexico. Sourcing patterns must follow the variety calendar, not just origin.
- Match channel to product form. Fresh-fruit foodservice and retail vs dried-mango processing are different markets — your supplier needs match accordingly. Check $/truck ratios in shipment records as a quick fresh-vs-processed signal.
- See who imports what: Search any company name and view their mango shipment history, variety mix, and supplier list.
- Find new suppliers: Browse Mexican, Peruvian, and Ecuadorian mango exporters and see which US importers they currently supply.
- Monitor competitors: Track when a competitor adds a new supplier or shifts volume between Pharr and Nogales — or between Ataulfo and Tommy Atkins.
- Analyze border patterns: See which ports — Pharr, McAllen, Nogales, Otay Mesa, Long Beach (sea) — handle the most mango traffic by week.
- Check FOB prices: USDA daily prices for mangoes at major US terminal markets, with historical trends and regional comparisons.
Track Mango Import Data in Real Time
ProduceTradeIQ gives you access to the same customs data that large mango importers use to monitor competitors. For mango specifically:
All data comes from official US government sources — CBP import records and USDA Market News — updated weekly.
Getting Started
The US mango import market is large, multi-origin, calendar-driven, and split between fresh and processed channels. Mexico dominates January-February and the March-September summer window via the Pharr corridor; Ecuador, Peru, Brazil, and Haiti fill the remaining months by sea; Vietnam is a growing irradiation-treated fresh sea-trade origin in winter.
Whether you're an established mango importer benchmarking your position, a retail produce buyer building a year-round variety program, or a procurement team sourcing dried mango for a snack brand, having access to shipment-level CBP data gives you a meaningful advantage on pricing, sourcing, and competitive intelligence.
For the live version of this roster — current importers and shipment volumes from CBP records, plus USDA FOB prices — see our US mango importers page.
Start your free trial on ProduceTradeIQ to search mango importers, view shipment records by variety, and track FOB USDA mango prices — all in one platform. No credit card required.
Data sources: CBP import records via ProduceTradeIQ (mx_shipments and zari_shipments tables); USDA Market News. Top importer and exporter rankings drawn from January-February 2026 CBP shipment records (HS subline 0804.50, fresh and dried guavas-mangoes-mangosteens, filtered to mango-specific product descriptions). Broker placeholders and aggregator entities flagged in the ProduceTradeIQ audit are excluded. Annual 2025 sea-trade origin reference covers full-year zari_shipments data.
See this data live on ProduceTradeIQ
Search any company, product, or trade route. 7-day free trial.
Start Free Trial