May 20, 2026 · 13 min read
San Luis, Arizona — The Yuma Leafy-Greens & Asparagus Corridor
Real shipment data — San Luis handles the Yuma-corridor specialty produce (leafy greens, asparagus, dates, brassicas) that Nogales doesn't touch. Top US importer roster, top Mexican shipper roster, and the Taylor Farms vertical-integration pipeline from Q1 2026 CBP records.
San Luis, Arizona handled 2,838 produce truckloads at $135.97 million in January-March 2026 — 6.2% of Arizona's total Mexican-produce volume and 1.96% of every Mexican produce truck crossing into the United States in the three-month window. It is the country's #9 US-Mexico produce port by volume — a long way behind Pharr-McAllen and Nogales, the two giants, but distinct from both in a way the rankings don't show: San Luis carries the commodity bundle that Nogales doesn't touch.
If Nogales is the Sinaloa winter greenhouse gateway — tomatoes, peppers, cucumbers, squash — then San Luis is the Yuma-corridor specialty crossing: head lettuce, asparagus, dates, cauliflower and Brussels sprouts, spinach. Different growing region, different harvest calendar, different importer community, and a different upstream supply structure dominated by one vertically-integrated operator. This guide maps the corridor with primary CBP data for Q1 2026.
The National Context — San Luis in the US-Mexico Produce Map
San Luis ranks #9 nationally by Mexican-produce truck volume in the Q1 2026 window. Two ports dominate; San Luis sits in the long tail, but the only Western-corridor crossing besides Nogales and Otay Mesa with any meaningful volume:
| Rank | US Port | Mexican Port (custom_port_state) | Trucks | Value (USD) |
|---|---|---|---|---|
| 1 | Pharr / McAllen, TX | Ciudad Reynosa (Tamaulipas) | 48,359 | $1.62B |
| 2 | Nogales, AZ (Mariposa + DeConcini) | Nogales (Sonora) | 43,246 | $668M |
| 3 | Laredo, TX (World Trade Bridge) | Nuevo Laredo (Tamaulipas) | 11,782 | $677M |
| 4 | Otay Mesa, CA | Tijuana (Baja California) | 10,768 | $428M |
| 5 | Calexico, CA | Mexicali (Baja California) | 8,087 | $177M |
| 6 | Laredo, TX (Colombia Solidarity Bridge) | Colombia (Nuevo León) | 8,022 | $653M |
| 7 | Donna, TX | Las Flores / Rio Bravo (Tamaulipas) | 5,139 | $29M |
| 8 | Roma / Rio Grande City, TX | Ciudad Miguel Alemán (Tamaulipas) | 4,417 | $112M |
| 9 | San Luis, AZ | San Luis Río Colorado (Sonora) | 2,838 | $136M |
Pharr-McAllen and Nogales together account for 63.2% of all Mexican produce trucks crossing into the US in the three-month window (91,605 of 145,009). San Luis, by contrast, is 1.96% — a small slice nationally but a structurally distinct one. For the Texas eastern corridor, see our Texas border crossings guide; for the Sinaloa-Sonora western volume leader, see our Nogales gateway guide.
Why San Luis is the Yuma Corridor's Crossing
San Luis owes its niche to geography, harvest timing, and the agricultural identity of the region on both sides of the border.
Geography — the Yuma-Mexicali desert ag belt. San Luis, Arizona sits at the southwestern tip of Yuma County, directly across the border from San Luis Río Colorado in Sonora. Yuma County is the dominant US winter-vegetable production region — leafy greens, broccoli, cauliflower, dates — and Mexicali-Sonora desert agriculture mirrors it on the Mexican side. The same hot-desert, irrigation-heavy growing model produces leafy greens, brassicas, and asparagus in a winter-spring rhythm distinct from Sinaloa's year-round greenhouse pace. Federal Highway 2 runs along the border from Mexicali through San Luis Río Colorado, feeding both the Mexicali corridor (which routes mostly to Calexico) and the San Luis Río Colorado corridor (which routes to San Luis, AZ).
Cold chain. Yuma's cold-chain density is substantial but architecturally different from Nogales's — fewer importer-distributor cold rooms clustered near the border, more direct-to-shipper or direct-to-processor flow. Loads that cross San Luis frequently transit to nearby Yuma packing-and-processing facilities for further consolidation before US-domestic distribution. The infrastructure follows the leafy-greens packer-shipper model rather than the Nogales reefer-broker repack model.
Harvest calendar. Sonora-Baja desert ag peaks November through April, with asparagus and spinach running March-May at their highest US-import volume. The Q1 2026 numbers reflect mid-season for the bulk leafy-greens commodities and the front-end of the asparagus ramp.
Importer community. San Luis's importer roster is dominated by leafy-greens packers and processors with Salinas / Yuma operational bases — Taylor Farms, D'Arrigo Bros, Bud Antle, Ippolito International, Crystal Valley Foods, Mr. Fresh Vegetables, Alpine Fresh. These are not the FPAA-anchored Nogales family operations. Different community, different industry sub-sector, different cross-border supply economics.
What Crosses at San Luis: The Commodity Mix
Eleven HS4 categories carry the meaningful volume. The signature is leafy greens + asparagus + dates + brassicas:
| HS4 | Category | Trucks | Value (USD) |
|---|---|---|---|
| 0705.1 | Head lettuce (iceberg + romaine) | 759 | $46.5M |
| 0709.20 | Asparagus | 642 | $19.3M |
| 0703.10 | Onions / shallots | 265 | $6.9M |
| 0704.9x | Cabbage / kale / brassica variants (excl. cauliflower) | 258 | $14.3M |
| 0704.10 | Cauliflower (HS 0704.10) | 211 | $7.6M |
| 0704.20 | Brussels sprouts | 196 | $3.9M |
| 0709.7 | Spinach | 196 | $16.2M |
| 0804.10 | Dates | 105 | $11.1M |
| 0705.2 | Other lettuce (butterhead, leaf) | 57 | $1.5M |
| 0709.9x | Other vegetables | 51 | $2.9M |
| 0709.40 | Celery | 39 | $1.1M |
Three observations worth flagging.
Asparagus is mid-ramp. Sonora-Baja desert asparagus has a tight March-May harvest window. Of the 642 asparagus trucks in the three-month window, roughly 354 — more than half — crossed in March alone, reflecting the front-end of the season ramp. The full-year asparagus volume through San Luis is meaningfully higher than the three-month figure implies — most of the harvest is still in the field as of the data cutoff.
Spinach is the premium-freight signal. By truck count spinach (196) is #5, but by value ($16.2M) it ranks #3 — roughly $82K per truck, more than double the per-truck value of head lettuce ($61K) and triple cauliflower ($38K). High-value baby-leaf and processor-grade spinach travels with denser packs, cold-chain margins, and pricing that reflects the Yuma-Salinas value-added supply chain rather than commodity field-pack leafy greens.
Dates are the only meaningful non-vegetable category. San Luis carries 105 truckloads of dates ($11.1M) in the three-month window — Sonora and Mexicali date-palm groves shipping Medjool and Deglet Noor through the closest US port. No other Arizona or California crossing handles meaningful date volume; this is San Luis's distinctive non-leafy specialty.
What does not cross San Luis: tomatoes, peppers, cucumbers, squash, watermelons, mangoes, limes. Those run through Nogales (Sinaloa-Sonora greenhouse), Pharr (Tamaulipas), or other corridors. Sinaloa winter-greenhouse vegetable volume that you might assume crosses through the nearest Arizona port doesn't — it crosses Nogales, 250 miles east.
The San Luis Importer Roster
These are the top 15 US importers receiving Mexican produce at San Luis in the three-month Q1 2026 window — derived from CBP shipment records, broker placeholders excluded:
| # | US Importer | Trucks | Decl | Value (USD) | Commodity mix (HS4) |
|---|---|---|---|---|---|
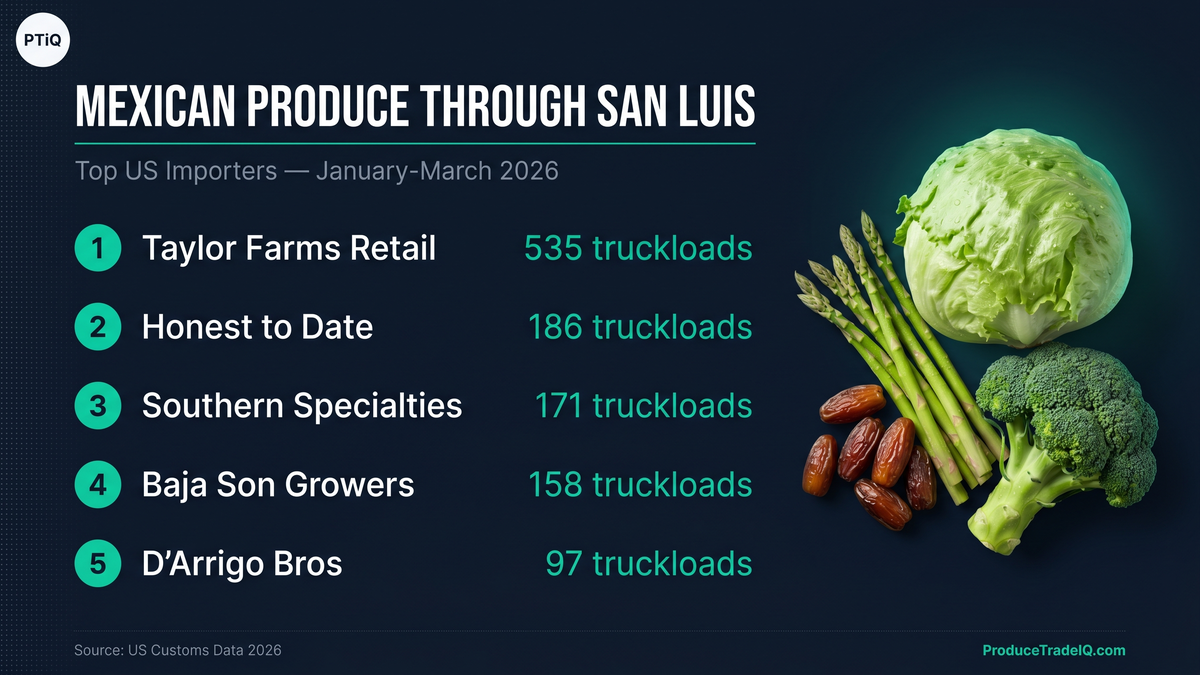
| 1 | Taylor Farms Retail Inc (entity A) | 361 | 45 | $24.3M | full leafy-greens range (13 HS4 categories) |
| 2 | Honest to Date LLC | 186 | 16 | $3.1M | onions, lettuce, asparagus, cauliflower, celery |
| 3 | Taylor Farms Retail Inc. (entity B variant) | 174 | 42 | $6.8M | leafy-greens range |
| 4 | Southern Specialties Inc | 171 | 19 | $3.1M | asparagus + Brussels sprouts |
| 5 | Baja Son Growers LLC | 158 | 17 | $3.5M | onions, asparagus |
| 6 | D'Arrigo Bros Co. of California | 97 | 7 | $0.9M | head lettuce (pure-play) |
| 7 | Ippolito International LP | 65 | 19 | $0.8M | Brussels sprouts, head lettuce, celery |
| 8 | Consolidated Farms (Crystal Valley Foods) | 64 | 9 | $2.9M | asparagus |
| 9 | Promotora Agrícola El Toro U.S.A. LLC | 63 | 10 | $1.4M | onions, cauliflower, Brussels sprouts, lettuce |
| 10 | Mr. Fresh Vegetables LLC | 55 | 18 | $1.0M | onions, Brussels sprouts, asparagus |
| 11 | Promotora Agrícola El Toro USA LLC (variant) | 54 | 14 | $1.1M | onions, cauliflower, Brussels sprouts |
| 12 | Farm Direct Supply LLC | 51 | 13 | $1.3M | asparagus |
| 13 | Global Agricultural Products LLC | 42 | 13 | $4.9M | dates (pure-play) |
| 14 | Bud Antle LLC | 40 | 20 | $1.0M | asparagus |
| 15 | Allium Fresh LLC | 40 | 10 | $0.8M | onions (pure-play) |
| 16 | Oasis Date Processing LLC | 38 | 55 | $3.8M | dates (pure-play) |
Taylor Farms — the US-side half of a vertically-integrated cross-border operation. Combining both Taylor Farms Retail Inc entity-name variants, Taylor Farms handled 535 of the 2,838 San Luis truckloads in the window — that's 18.9% (535 ÷ 2,838). The largest single importer at San Luis by a wide margin, with the broadest commodity mix in the top-15 (13 HS4 categories — full leafy-greens range). But the more interesting number sits on the Mexican-shipper side (next section): Taylor Farms's Baja California sibling operation crosses more than twice that in trucks at the same port. The pairing is the structural story; Taylor Farms is not just a big US buyer at San Luis — it is operating a captive cross-border pipeline from its own MX growing-processing footprint to its US retail-fresh-vegetables division.
The diversification angle. The Q1 2026 top-15 includes several operators driven heavily by March traffic — D'Arrigo Bros Co. of California (97 trucks, pure-play head lettuce, all of it concentrated in March-season volume), Mr. Fresh Vegetables LLC (55 trucks, diversified), Allium Fresh LLC (40 trucks, pure-play onions). Combined with strong showings from Southern Specialties and Bud Antle, the importer base is broader than the headline Taylor Farms concentration suggests. The corridor reads as broadening rather than consolidating.
Among the date specialists, Global Agricultural Products LLC (42 trucks, $4.9M) and Oasis Date Processing LLC (38 trucks, $3.8M) anchor the date sub-corridor. Per-truck date values run roughly $100K — premium-freight specialty volume in a market with very few competing crossings.
Top Mexican Shippers Through San Luis
This is the corridor-specific Mexican-side roster — the top 10 shippers exporting through San Luis in Q1 2026:
| # | Mexican Shipper | Trucks | Decl | Value (USD) | Commodity profile |
|---|---|---|---|---|---|
| 1 | Taylor Farms Baja California S de RL de CV | 1,092 | 116 | $83.2M | full leafy-greens range (13 HS4 categories) |
| 2 | Empaque Río Colorado SPR de RL de CV | 207 | 18 | $3.5M | onions, lettuce, asparagus, dates |
| 3 | Church Brothers del Norte S de RL de CV | 207 | 18 | $9.1M | onions, cauliflower, lettuce, asparagus, peppers |
| 4 | Exportadora de Caborca SA de CV | 151 | 12 | $3.3M | asparagus (pure-play) |
| 5 | Promotora Agrícola El Toro SA de CV | 146 | 30 | $3.1M | onions, cauliflower, lettuce, celery |
| 6 | Sonoran Specialties SA de CV | 143 | 11 | $2.5M | asparagus + Brussels sprouts |
| 7 | Colorado River Farm S.P.R. de R.L. | 97 | 7 | $0.9M | head lettuce (pure-play) |
| 8 | AV Farms SA de CV | 67 | 11 | $3.0M | asparagus |
| 9 | Campo Agrícola El Socorro S.P.R. de R.L. | 46 | 9 | $0.9M | asparagus |
| 10 | Moctezuma Medjool Gardens S de RL de CV | 44 | 16 | $5.1M | dates (pure-play, Medjool) |
Taylor Farms Baja California — the Mexican-side anchor. 1,092 of the 2,838 San Luis truckloads — that's 38.5% (1,092 ÷ 2,838). By value, Taylor Farms Baja California shipped $83.2 million of the $135.97 million total San Luis MX-side value — 61% (83.2 ÷ 135.97). No other shipper at any major US-Mexico produce port in our coverage holds anything close to a 38.5%-of-volume / 61%-of-value position. This is structurally exceptional.
The vertical-integration pairing. Taylor Farms Baja California's 1,092 outbound trucks pair with Taylor Farms US-side's 535 inbound trucks. The vertical integration is the structural story, not the standalone concentration of either entity. Take either number in isolation and the picture is incomplete:
- 18.9% US-side share makes Taylor Farms look like a large but unremarkable Yuma-corridor importer.
- 38.5% MX-side share makes Taylor Farms Baja California look like an outlier MX-side concentration with no parallel.
- Together, the two numbers describe a single vertically-integrated operator running Baja California growing-and-processing through to US retail fresh-vegetable supply via its own border crossing — the most concentrated vertical pipeline in our cross-border produce dataset.
Captive vs third-party shipping. Of the 1,092 trucks Taylor Farms Baja California shipped through San Luis in Q1 2026, only roughly 535 went to Taylor Farms US entities (the captive flow). The remaining ~557 trucks — more than half — shipped to other US buyers. Taylor Farms Baja California is not a pure captive supplier; it operates as both an internal pipeline for the Taylor Farms US business and as an independent merchant shipper to third-party importers. The dual role is uncommon at this scale. It suggests the Baja California operation is sized larger than the US retail division's own requirements and uses the excess capacity to run a separate merchant business through the same border infrastructure.
The rest of the Mexican-shipper roster. Beyond Taylor Farms Baja California, the MX-side reads like a Yuma-mirror image of the US-side: Empaque Río Colorado and Church Brothers del Norte run diversified leafy-greens programs; Exportadora de Caborca, Sonoran Specialties, AV Farms, and Campo Agrícola El Socorro are asparagus specialists riding the Sonora harvest season; Colorado River Farm is a head-lettuce pure-play; Moctezuma Medjool Gardens anchors the date-palm sub-corridor with $5.1M in 44 truckloads (~$117K per truck — premium Medjool freight). The Sonora-Baja desert-ag identity is fully visible in the shipper roster.
Why San Luis Is NOT Nogales: Two Parallel Corridors
San Luis and Nogales sit 250 miles apart in the same US state, fed by the same Mexican state (Sonora), and yet they are structurally different corridors. Five dimensions of contrast, all visible in the Q1 2026 data:
| Dimension | Nogales, AZ | San Luis, AZ |
|---|---|---|
| Q1 2026 truckloads | 43,246 | 2,838 |
| Q1 2026 USD value | $668M | $136M |
| Dominant commodities | Tomatoes, peppers, cucumbers, squash (the "Big Four" greenhouse signature, 82% of volume) | Head lettuce, asparagus, cauliflower, Brussels sprouts, dates |
| Upstream production | Sinaloa Culiacán-valley greenhouses + Sonora field veg | Sonora-Baja desert ag (Yuma-mirror), date palm groves |
| Harvest rhythm | Year-round greenhouse (peak Oct-May) | Seasonal desert ag (peak Nov-Apr, asparagus Mar-May) |
| Importer community | FPAA-anchored multi-generational Nogales families | Salinas-Yuma leafy-greens packers / processors |
| Concentration profile | Distributed; top-15 = 19% of volume; no single dominant operator | Vertical-pipeline structure; Taylor Farms US 18.9% + Taylor Farms Baja California 38.5% MX-side |
| Cold-chain model | Border-clustered reefer broker repack | Direct-to-Yuma processor / packer flow |
The commodity contrast is the cleanest read. The Sinaloa winter-greenhouse Big Four — tomatoes, peppers, cucumbers, squash — together represent more than 22,000 trucks at Nogales in Q1 2026 and zero meaningful volume at San Luis. Conversely, the San Luis Yuma signature — head lettuce, asparagus, dates, brassicas — has zero meaningful volume at Nogales. Two corridors, two non-overlapping commodity sets, two completely different importer communities. The Sinaloa story is documented in our Sinaloa export guide; the Nogales corridor structure in our Nogales gateway guide.
If you are sourcing winter tomatoes or peppers from Mexico, Nogales is your port. If you are sourcing winter leafy greens, asparagus, Sonora dates, or brassicas, San Luis is your port. The two are not interchangeable. They are not even close.
How to Choose San Luis vs Nogales vs Otay Mesa
Match the commodity and the origin region to the corridor:
- Yuma-mirror leafy greens (head lettuce, romaine, baby spinach, leafy mix), Sonora-Baja asparagus, Sonora-region cauliflower and Brussels sprouts, Sonora date palm production → San Luis, AZ. The corridor that handles exactly what its name suggests it should.
- Sinaloa Culiacán-valley winter greenhouse tomatoes, peppers, cucumbers, squash, eggplant, melons → Nogales, AZ. Different state of origin, different commodity bundle, different importer community. See our Nogales gateway guide.
- Tamaulipas-origin tomatoes, peppers, cucumbers, onions, watermelons → Pharr / McAllen, TX. See our Texas border crossings guide and McAllen-Pharr port guide.
- Michoacán Hass avocados → Laredo, TX. The Michoacán-to-Laredo inland route is the avocado superhighway; San Luis sees zero avocado.
- Limes (Persian / Tahiti and Key) → Pharr, TX. Tamaulipas-routed Veracruz / Michoacán production. See our Persian vs Tahiti lime guide for cultivar split and lime importers guide for the buyer roster.
- Baja California greenhouse and field production destined for Southern California → Otay Mesa, CA. Tijuana-side flows go here, not to San Luis.
- Mexicali-Imperial Valley dual-region produce → Calexico, CA primarily. Some Mexicali outflow does route to San Luis when shippers consolidate at San Luis Río Colorado, but the larger Mexicali-side volume crosses 60 miles west at Calexico.
For pricing context, each US-side crossing produces its own USDA Market News FOB shipping-point quotes. Yuma daily quotes are the benchmark for the Yuma-corridor leafy greens and asparagus, distinct from Nogales (Sinaloa-Sonora greenhouse) and Pharr (Tamaulipas) benchmarks. See our FOB pricing explainer. For background on the four customs systems behind these records, see our CBP AMS data explainer.
Getting Started
San Luis is the Yuma corridor's crossing — small in absolute volume next to Pharr or Nogales, but the only US-Mexico port carrying the Sonora-Baja desert-ag specialty bundle of leafy greens, asparagus, brassicas, and dates. Its US importer community is the Salinas-Yuma leafy-greens packer-processor world, anchored by a Taylor Farms vertically-integrated pipeline that ships 1,092 trucks from Baja California into 535 US-side receipts and roughly 557 more to third-party buyers — the most concentrated vertical operation in the cross-border produce dataset.
Start your free trial on ProduceTradeIQ to filter shipments by San Luis crossing, see who is buying through Yuma vs Nogales vs Pharr, identify the Sonora-Baja shippers active in the corridor, and track USDA FOB prices at the Yuma-corridor shipping points. No credit card required.
Data sources: CBP-derived shipment records via the ProduceTradeIQ platform (mx_shipments table). Window: January 1 – March 31, 2026 (Q1 2026, three-month window). San Luis attribution derived from the SAN LUIS RIO COLORADO custom_port_state value, which covers all commercial produce traffic between San Luis Río Colorado, Sonora and San Luis, Arizona. Truckload counts derived from line-item kilograms divided by 22,000 kg standard refrigerated trailer payload. USD values are sums of CBP-reported invoice values. Broker placeholders and aggregator entities flagged in the ProduceTradeIQ audit are excluded. Concentration percentages computed as count ÷ window total; Taylor Farms US-side 18.9% = 535 ÷ 2,838; Taylor Farms Baja California MX-side 38.5% = 1,092 ÷ 2,838, value-share 61% = 83.2M ÷ 135.97M.
See this data live on ProduceTradeIQ
Search any company, product, or trade route. 7-day free trial.
Start Free Trial